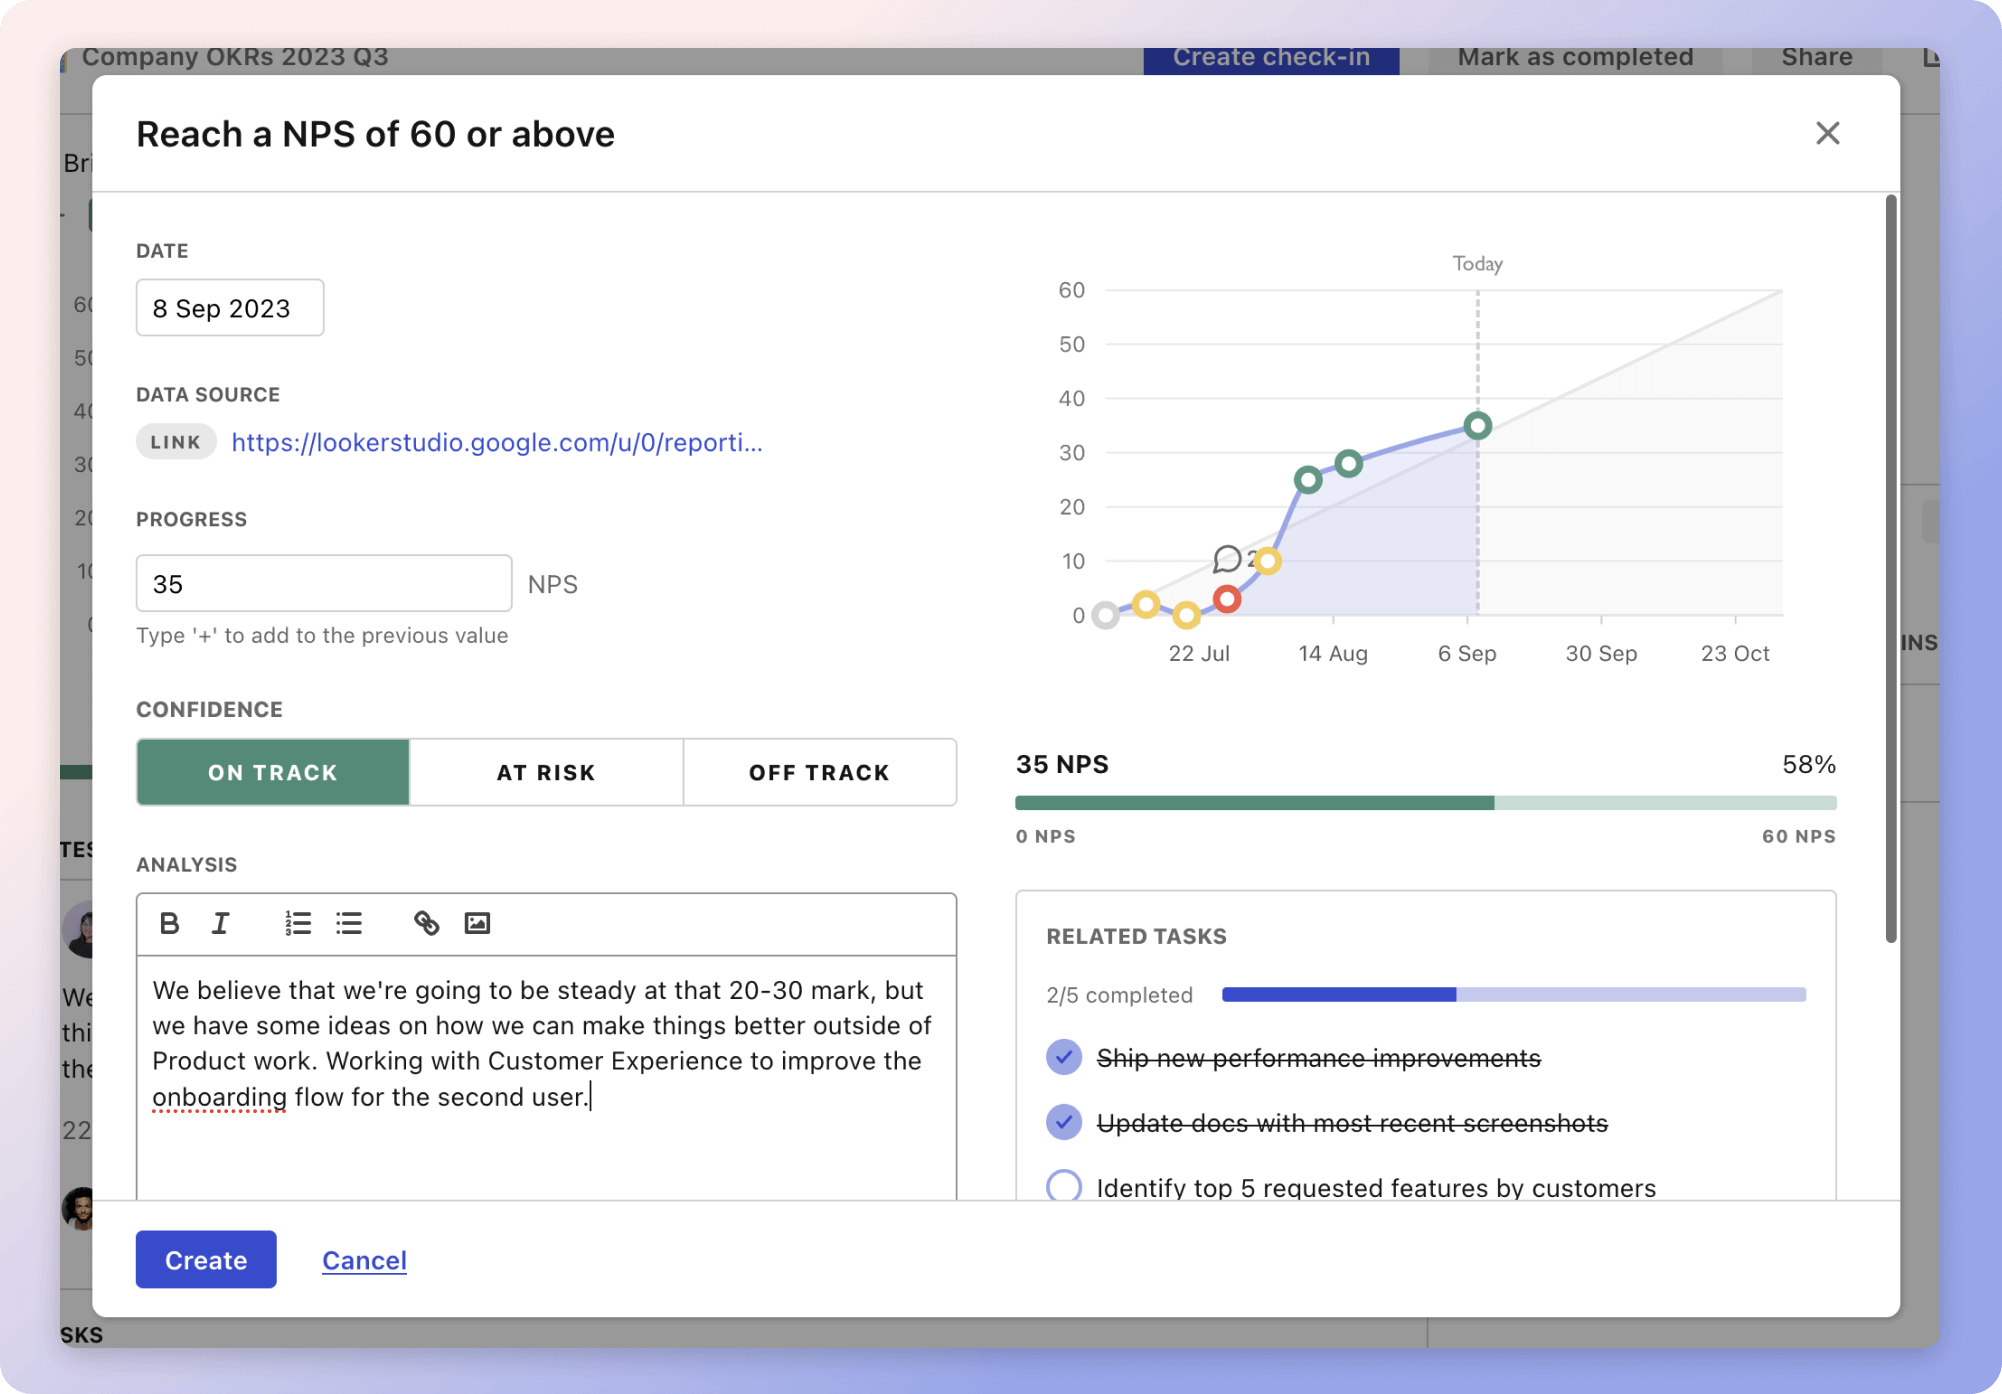
The aim of this plan is to measure key performance metrics for backend development, ensuring systems are efficient and reliable. Metrics like Response Time, Error Rate, Request Per Second, CPU Utilisation, and Memory Usage are critical as they directly impact user experience and system stability.
For example, optimising Response Time improves user satisfaction, while a low Error Rate indicates robust backend stability. Monitoring CPU Utilisation and Memory Usage helps in maintaining resource efficiency, reducing operational costs, and ensuring smooth performance.
These metrics are important as they guide improvement strategies, like optimising database queries, using efficient algorithms, and implementing caching.
Top 5 metrics for Measuring Backend Development
1. Response Time
The time taken for a system to respond to a request, typically measured in milliseconds.
What good looks like for this metric: 100-200 ms
How to improve this metric:- Optimise database queries
- Use efficient algorithms
- Implement caching strategies
- Scale infrastructure
- Minimise network latency
2. Error Rate
The percentage of requests that result in errors, such as 4xx or 5xx HTTP status codes.
What good looks like for this metric: Less than 1%
How to improve this metric:- Improve input validation
- Conduct thorough testing
- Use error monitoring tools
- Implement robust exception handling
- Optimize API endpoints
3. Request Per Second (RPS)
The number of requests the server can handle per second.
What good looks like for this metric: 1000-5000 RPS
How to improve this metric:- Use load balancing
- Optimise server performance
- Increase concurrency
- Implement rate limiting
- Scale vertically and horizontally
4. CPU Utilisation
The percentage of CPU resources used by the backend server.
What good looks like for this metric: 50-70%
How to improve this metric:- Profile and optimise code
- Distribute workloads evenly
- Scale infrastructure
- Use efficient data structures
- Reduce computational complexity
5. Memory Usage
The amount of memory consumed by the backend server.
What good looks like for this metric: Less than 85% of total memory
How to improve this metric:- Identify and fix memory leaks
- Optimise data storage
- Use garbage collection
- Implement memory caching
- Scale infrastructure
How to track Measuring Backend Development metrics
It's one thing to have a plan, it's another to stick to it. We hope that the examples above will help you get started with your own strategy, but we also know that it's easy to get lost in the day-to-day effort.
That's why we built Tability: to help you track your progress, keep your team aligned, and make sure you're always moving in the right direction.

Give it a try and see how it can help you bring accountability to your metrics.