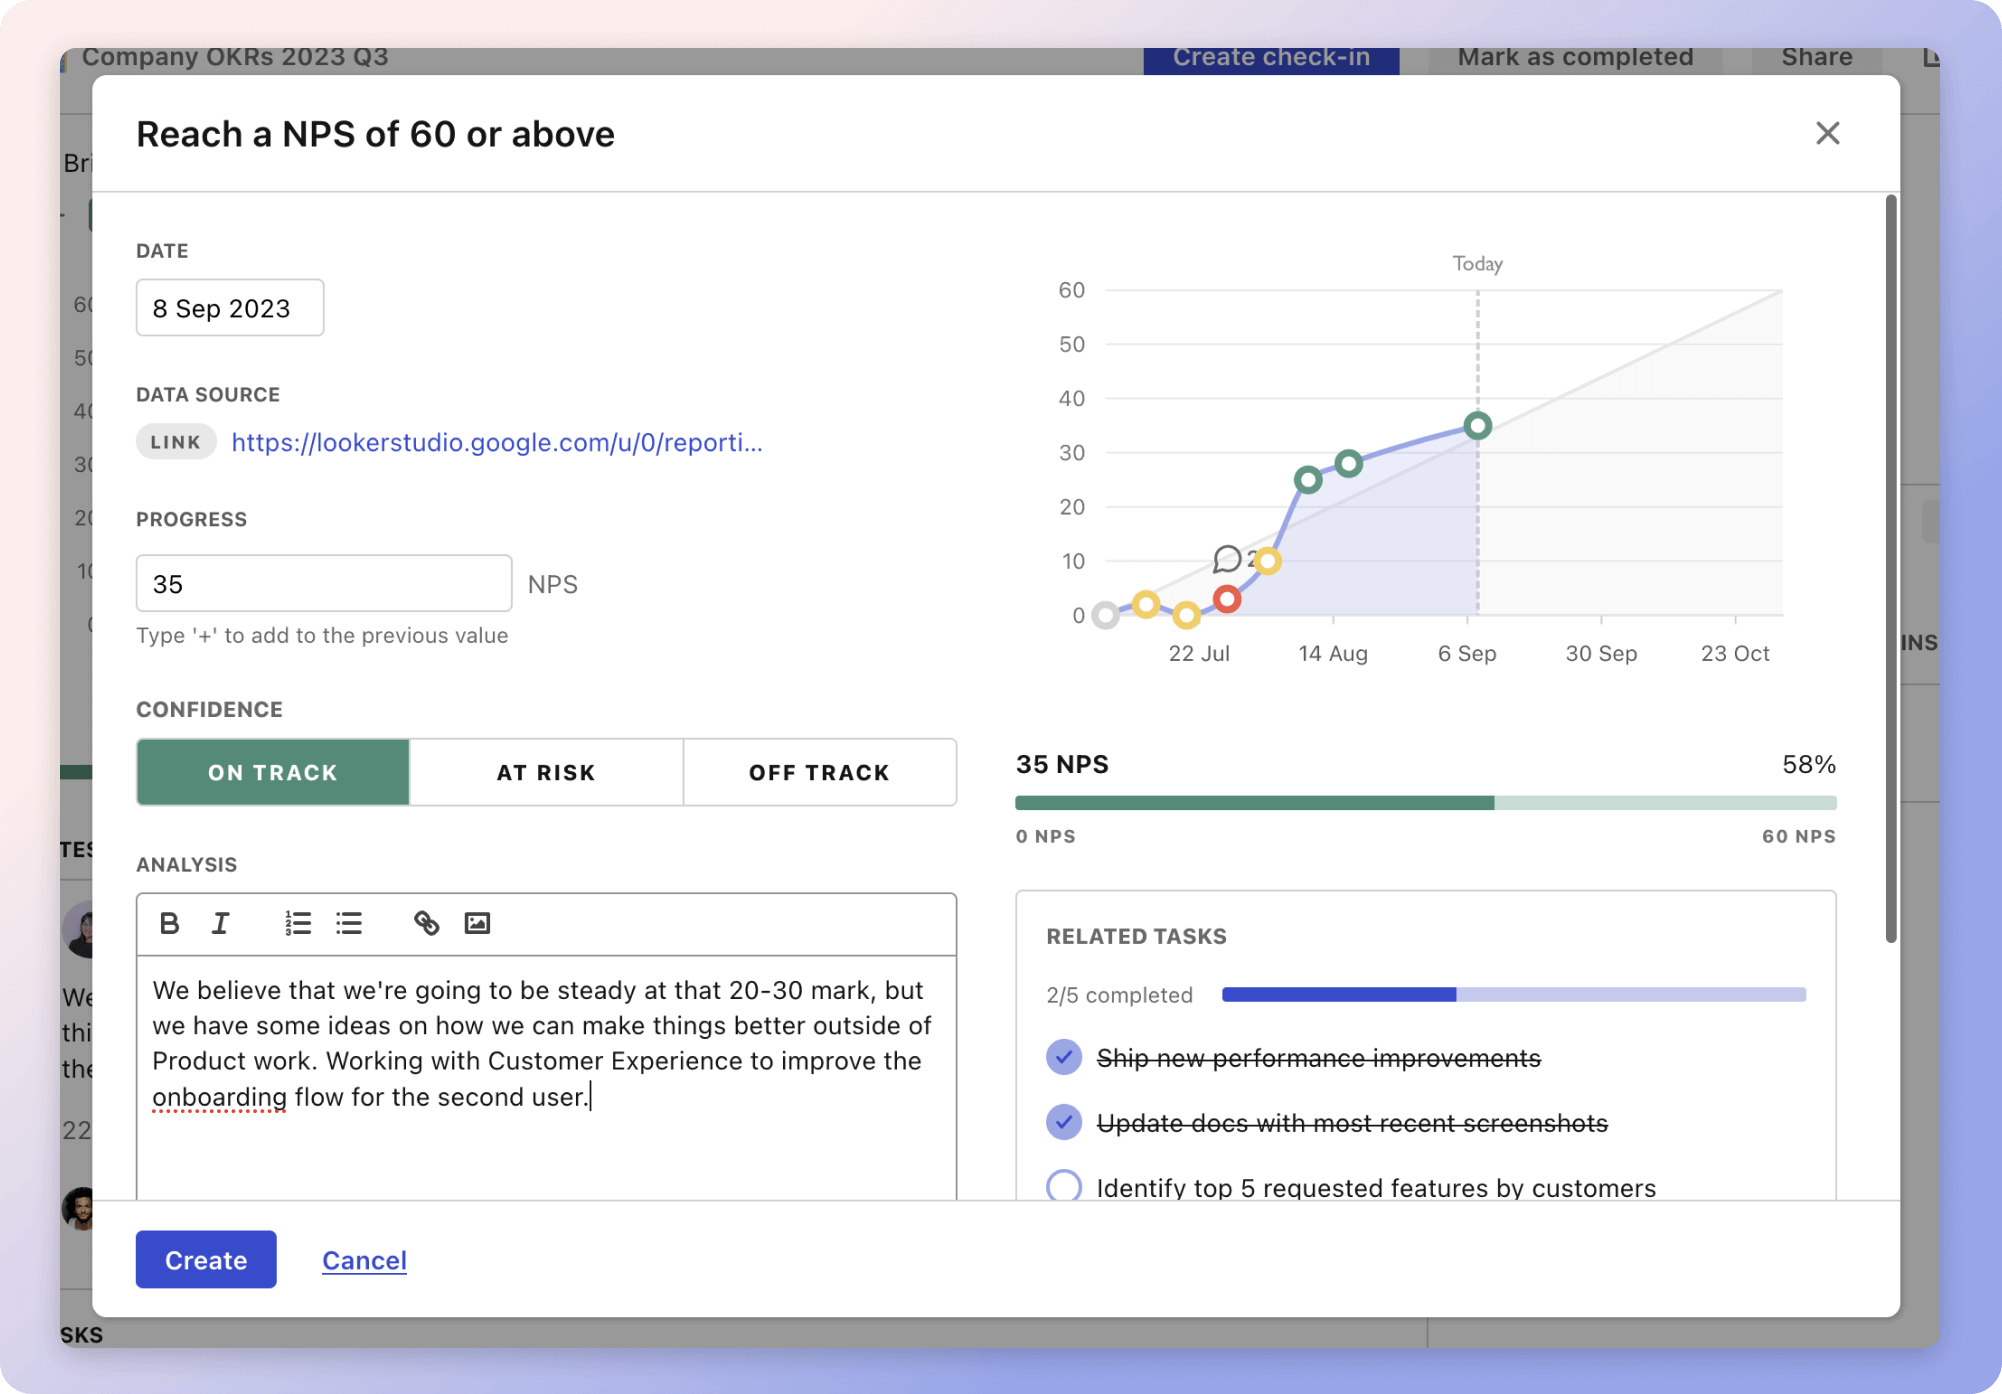
The plan focuses on optimizing the handling of log files by setting clear benchmarks across essential metrics. Throughput is crucial, as processing 40,000 log files per minute ensures efficient data management. For instance, upgrading server hardware can boost performance. Latency is also vital; by reducing processing time below 100 milliseconds, data remains timely and relevant, which is achieved through methods like caching.
Error rates must be minimized to less than 1% to maintain data integrity, necessitating robust error handling mechanisms. Meanwhile, resource utilization should stay below 80% to prevent overloading the system, promoting efficiency through scaling strategies. Finally, system uptime at 99.9% ensures high availability, critical for continuous operations, supported by reliable cloud services and regular maintenance.
Top 5 metrics for Handling Log Files
1. Throughput
Measures the number of log files processed per minute to ensure the service meets the 40k requirement
What good looks like for this metric: 40,000 log files per minute
How to improve this metric:- Optimize log processing algorithms
- Upgrade server hardware
- Use a load balancer to distribute requests
- Implement batch processing for logs
- Minimize unnecessary logging
2. Latency
Measures the time it takes to process each log file from receipt to completion
What good looks like for this metric: Less than 100 milliseconds
How to improve this metric:- Streamline data pathways
- Prioritise real-time log processing
- Identify and remove processing bottlenecks
- Utilise caching mechanisms
- Optimize database queries
3. Error Rate
Tracks the percentage of log files that are not processed correctly
What good looks like for this metric: Less than 1%
How to improve this metric:- Implement robust error handling mechanisms
- Conduct regular integration tests
- Utilise validation before processing logs
- Enhance logging system for transparency
- Review and improve exception handling
4. Resource Utilisation
Measures the use of CPU, memory, and network to ensure efficient handling of logs
What good looks like for this metric: Below 80% for CPU and memory utilisation
How to improve this metric:- Optimize code for better performance
- Implement vertical or horizontal scaling
- Regularly monitor and adjust resource allocation
- Use lightweight libraries or frameworks
- Run performance diagnostics regularly
5. System Uptime
Tracks the percentage of time the system is operational and able to handle log files
What good looks like for this metric: 99.9% uptime
How to improve this metric:- Implement redundancies in infrastructure
- Schedule regular maintenance
- Monitor system health continuously
- Use reliable cloud services
- Establish quick recovery protocols
How to track Handling Log Files metrics
It's one thing to have a plan, it's another to stick to it. We hope that the examples above will help you get started with your own strategy, but we also know that it's easy to get lost in the day-to-day effort.
That's why we built Tability: to help you track your progress, keep your team aligned, and make sure you're always moving in the right direction.

Give it a try and see how it can help you bring accountability to your metrics.