Get Tability: OKRs that don't suck | Learn more →

Database Administrator metrics and KPIs

What are Database Administrator metrics?

Identifying the optimal Database Administrator metrics can be challenging, especially when everyday tasks consume your time. To help you, we've assembled a list of examples to ignite your creativity.

Copy these examples into your preferred app, or you can also use Tability to keep yourself accountable.

Find Database Administrator metrics with AI

While we have some examples available, it's likely that you'll have specific scenarios that aren't covered here. You can use our free AI metrics generator below to generate your own strategies.

Examples of Database Administrator metrics and KPIs

Metrics for Data Uptime Measurement

  • 1. Job Success Rate

    Percentage of SQL Server jobs that complete successfully without errors during the specified window

    What good looks like for this metric: Typically above 95%

    Ideas to improve this metric
    • Optimise SQL queries to reduce execution time
    • Implement real-time monitoring and alerting
    • Increase server capacity during the job window
    • Regularly maintain and update indexes
    • Perform routine job error analysis and debugging
  • 2. Average Job Duration

    Average time taken by SQL jobs to complete within the window

    What good looks like for this metric: Should align with historical average time

    Ideas to improve this metric
    • Refactor and optimise slow-performing queries
    • Avoid unnecessary data processing
    • Use SQL Server execution plans for analysis
    • Schedule jobs in sequence to avoid performance bottlenecks
    • Utilise parallel processing when possible
  • 3. Data Availability

    Percentage of time that data is available and ready for use by end-users after job completion

    What good looks like for this metric: Typically above 99%

    Ideas to improve this metric
    • Set up redundancy for critical tables
    • Automate data validation checks post-job completion
    • Implement failover strategies
    • Ensure network reliability and minimise downtime
    • Regularly back up and securely store data
  • 4. Error Frequency

    Count of errors encountered during SQL job processing

    What good looks like for this metric: Typically less than 5 errors per month

    Ideas to improve this metric
    • Conduct thorough testing before deployment
    • Use transaction logs to identify error sources
    • Ensure up-to-date error handling mechanisms
    • Regularly review job logs for anomalies
    • Provide regular training for administrators
  • 5. Resource Utilisation

    Percentage of server resources used during job processing

    What good looks like for this metric: Should not consistently exceed 70%

    Ideas to improve this metric
    • Balance load across multiple servers
    • Monitor and adjust resource allocation
    • Upgrade hardware capacity if needed
    • Eliminate unused processes during job execution
    • Use performance counters to track and adjust load

Tracking your Database Administrator metrics

Having a plan is one thing, sticking to it is another.

Having a good strategy is only half the effort. You'll increase significantly your chances of success if you commit to a weekly check-in process.

A tool like Tability can also help you by combining AI and goal-setting to keep you on track.
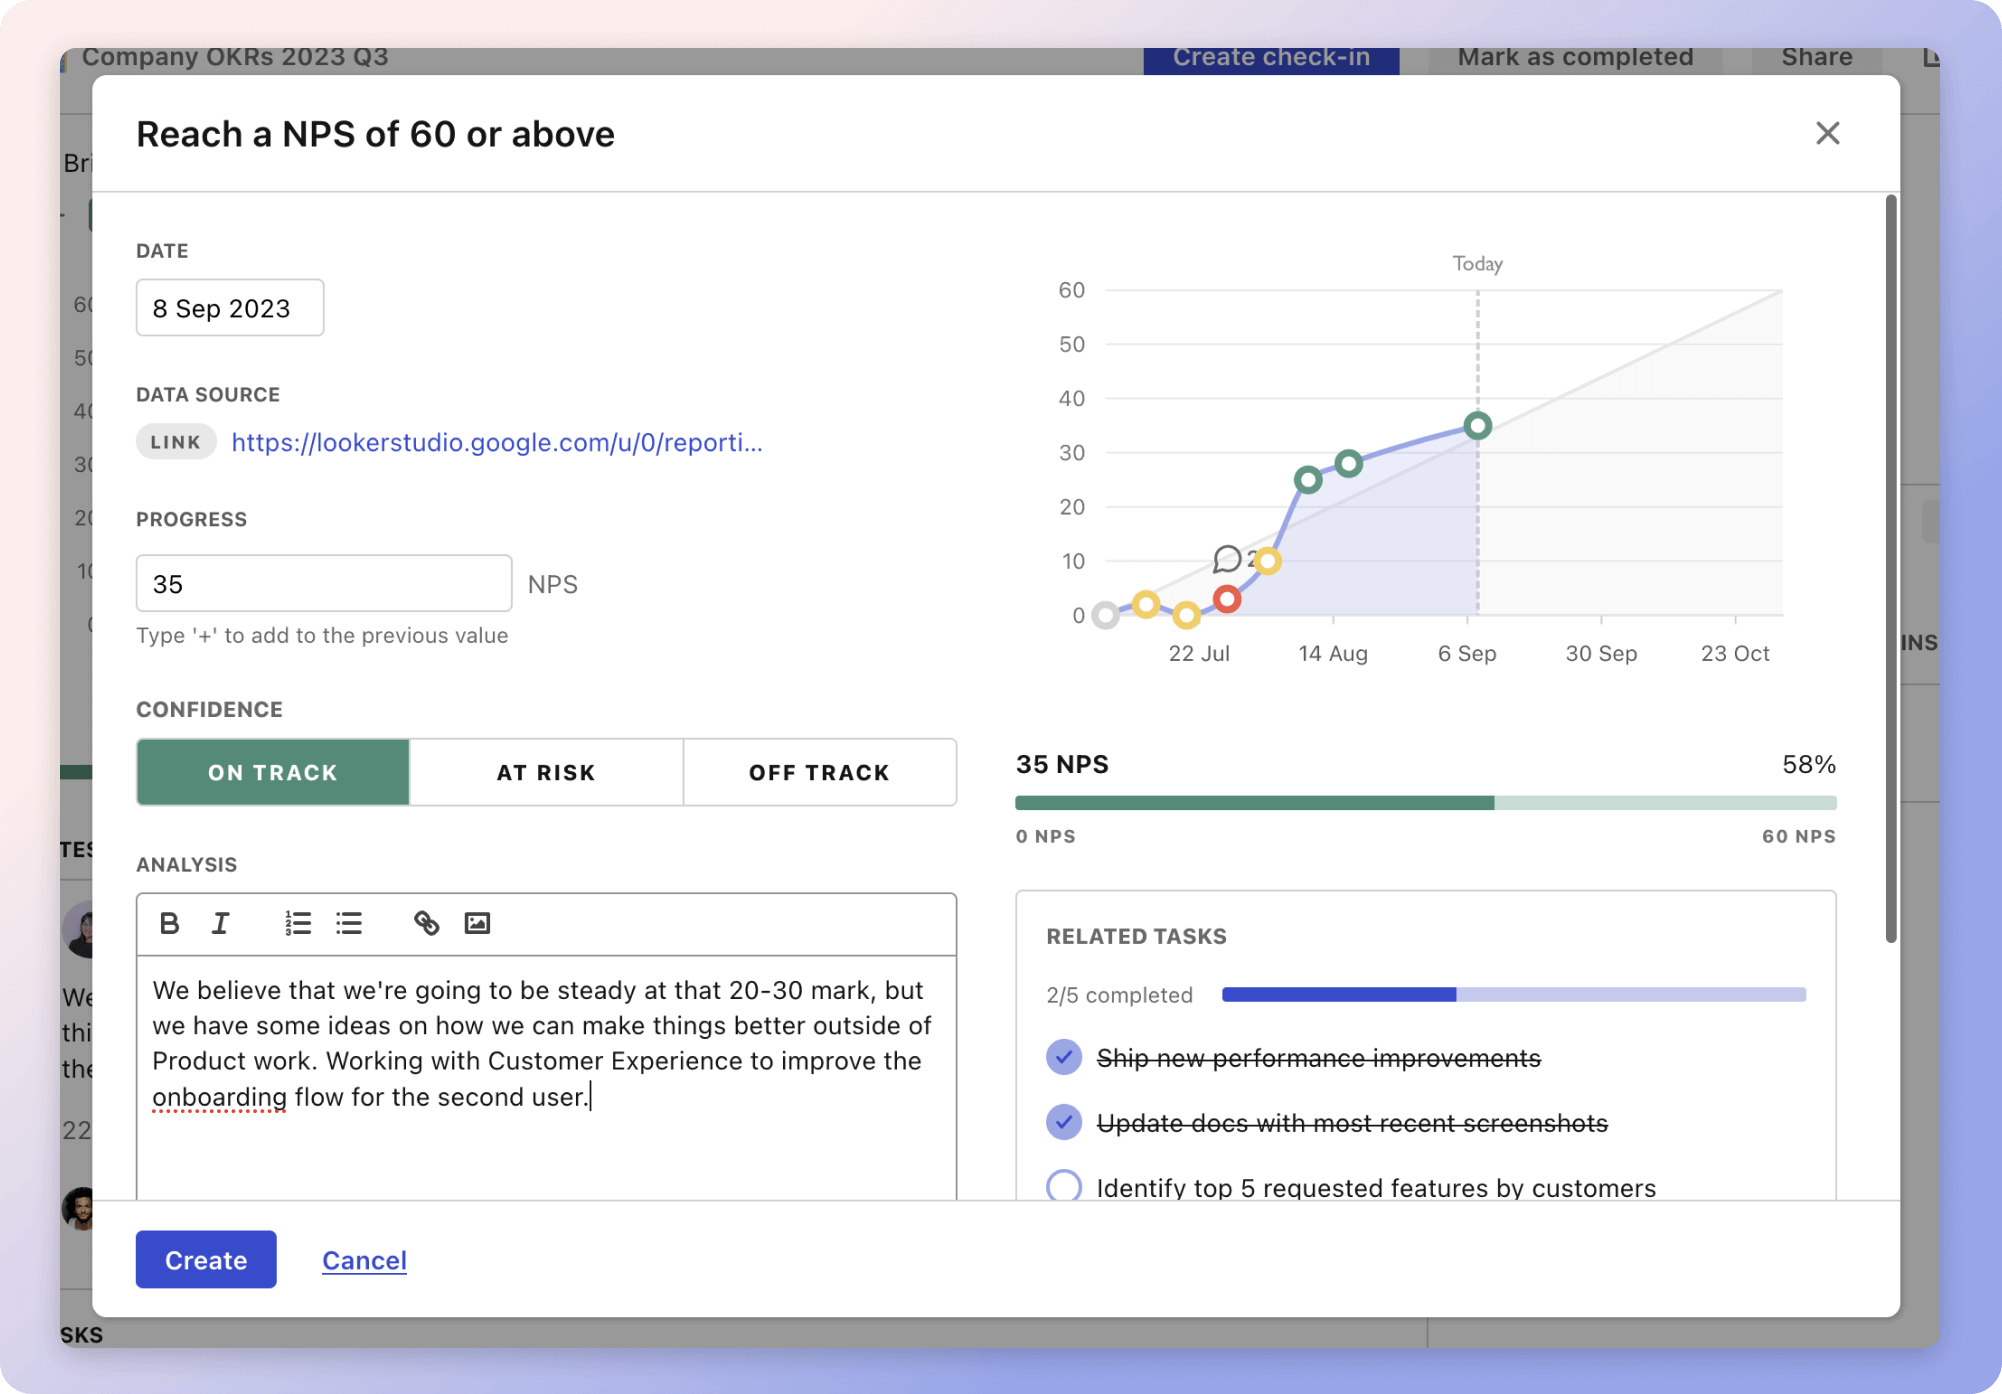
Tability Insights DashboardTability's check-ins will save you hours and increase transparency

More metrics recently published

We have more examples to help you below.

Planning resources

OKRs are a great way to translate strategies into measurable goals. Here are a list of resources to help you adopt the OKR framework:

Table of contents