Get Tability: OKRs that don't suck | Learn more →

Test Coverage metrics and KPIs

What are Test Coverage metrics?

Identifying the optimal Test Coverage metrics can be challenging, especially when everyday tasks consume your time. To help you, we've assembled a list of examples to ignite your creativity.

You can copy these examples into your preferred app, or alternatively, use Tability to stay accountable.

Find Test Coverage metrics with AI

While we have some examples available, it's likely that you'll have specific scenarios that aren't covered here. You can use our free AI metrics generator below to generate your own strategies.

Examples of Test Coverage metrics and KPIs

Metrics for Evaluating Test Performance

  • 1. Test Coverage

    Measures the percentage of the codebase tested by automated tests, calculated as (number of lines or code paths tested / total lines or code paths) * 100

    What good looks like for this metric: 70%-90% for well-tested code

    Ideas to improve this metric
    • Increase automation in testing
    • Refactor complex code to simplify testing
    • Utilise test-driven development
    • Regularly update and review test cases
    • Incorporate pair programming
  • 2. Defect Density

    Calculates the number of confirmed defects divided by the size of the software entity being measured, typically measured as defects per thousand lines of code

    What good looks like for this metric: Less than 1 bug per 1,000 lines

    Ideas to improve this metric
    • Conduct thorough code reviews
    • Implement static code analysis
    • Improve developer training
    • Use standard coding practices
    • Perform regular software audits
  • 3. Test Execution Time

    The duration taken to execute all test cases, calculated by summing up the time taken for all tests

    What good looks like for this metric: Shorter is better; aim for less than 30 minutes

    Ideas to improve this metric
    • Optimise test scripts
    • Use parallel testing
    • Remove redundant tests
    • Upgrade testing tools or infrastructure
    • Automate test environment setup
  • 4. Code Churn Rate

    Measures the amount of code change within a given period, calculated as the number of lines of code added, modified, or deleted

    What good looks like for this metric: 5%-10% considered manageable

    Ideas to improve this metric
    • Emphasise on quality over quantity in changes
    • Increase peer code reviews
    • Ensure clear and precise project scopes
    • Monitor team workload to avoid burnout
    • Provide comprehensive documentation
  • 5. User Reported Defects

    Counts the number of defects reported by users post-release, provides insights into the software's real-world performance

    What good looks like for this metric: Strive for zero, but less than 5% of total defects

    Ideas to improve this metric
    • Enhance pre-release testing
    • Gather detailed user feedback
    • Offer user training and resources
    • Implement beta testing
    • Regularly update with patches and fixes

Tracking your Test Coverage metrics

Having a plan is one thing, sticking to it is another.

Setting good strategies is only the first challenge. The hard part is to avoid distractions and make sure that you commit to the plan. A simple weekly ritual will greatly increase the chances of success.

A tool like Tability can also help you by combining AI and goal-setting to keep you on track.
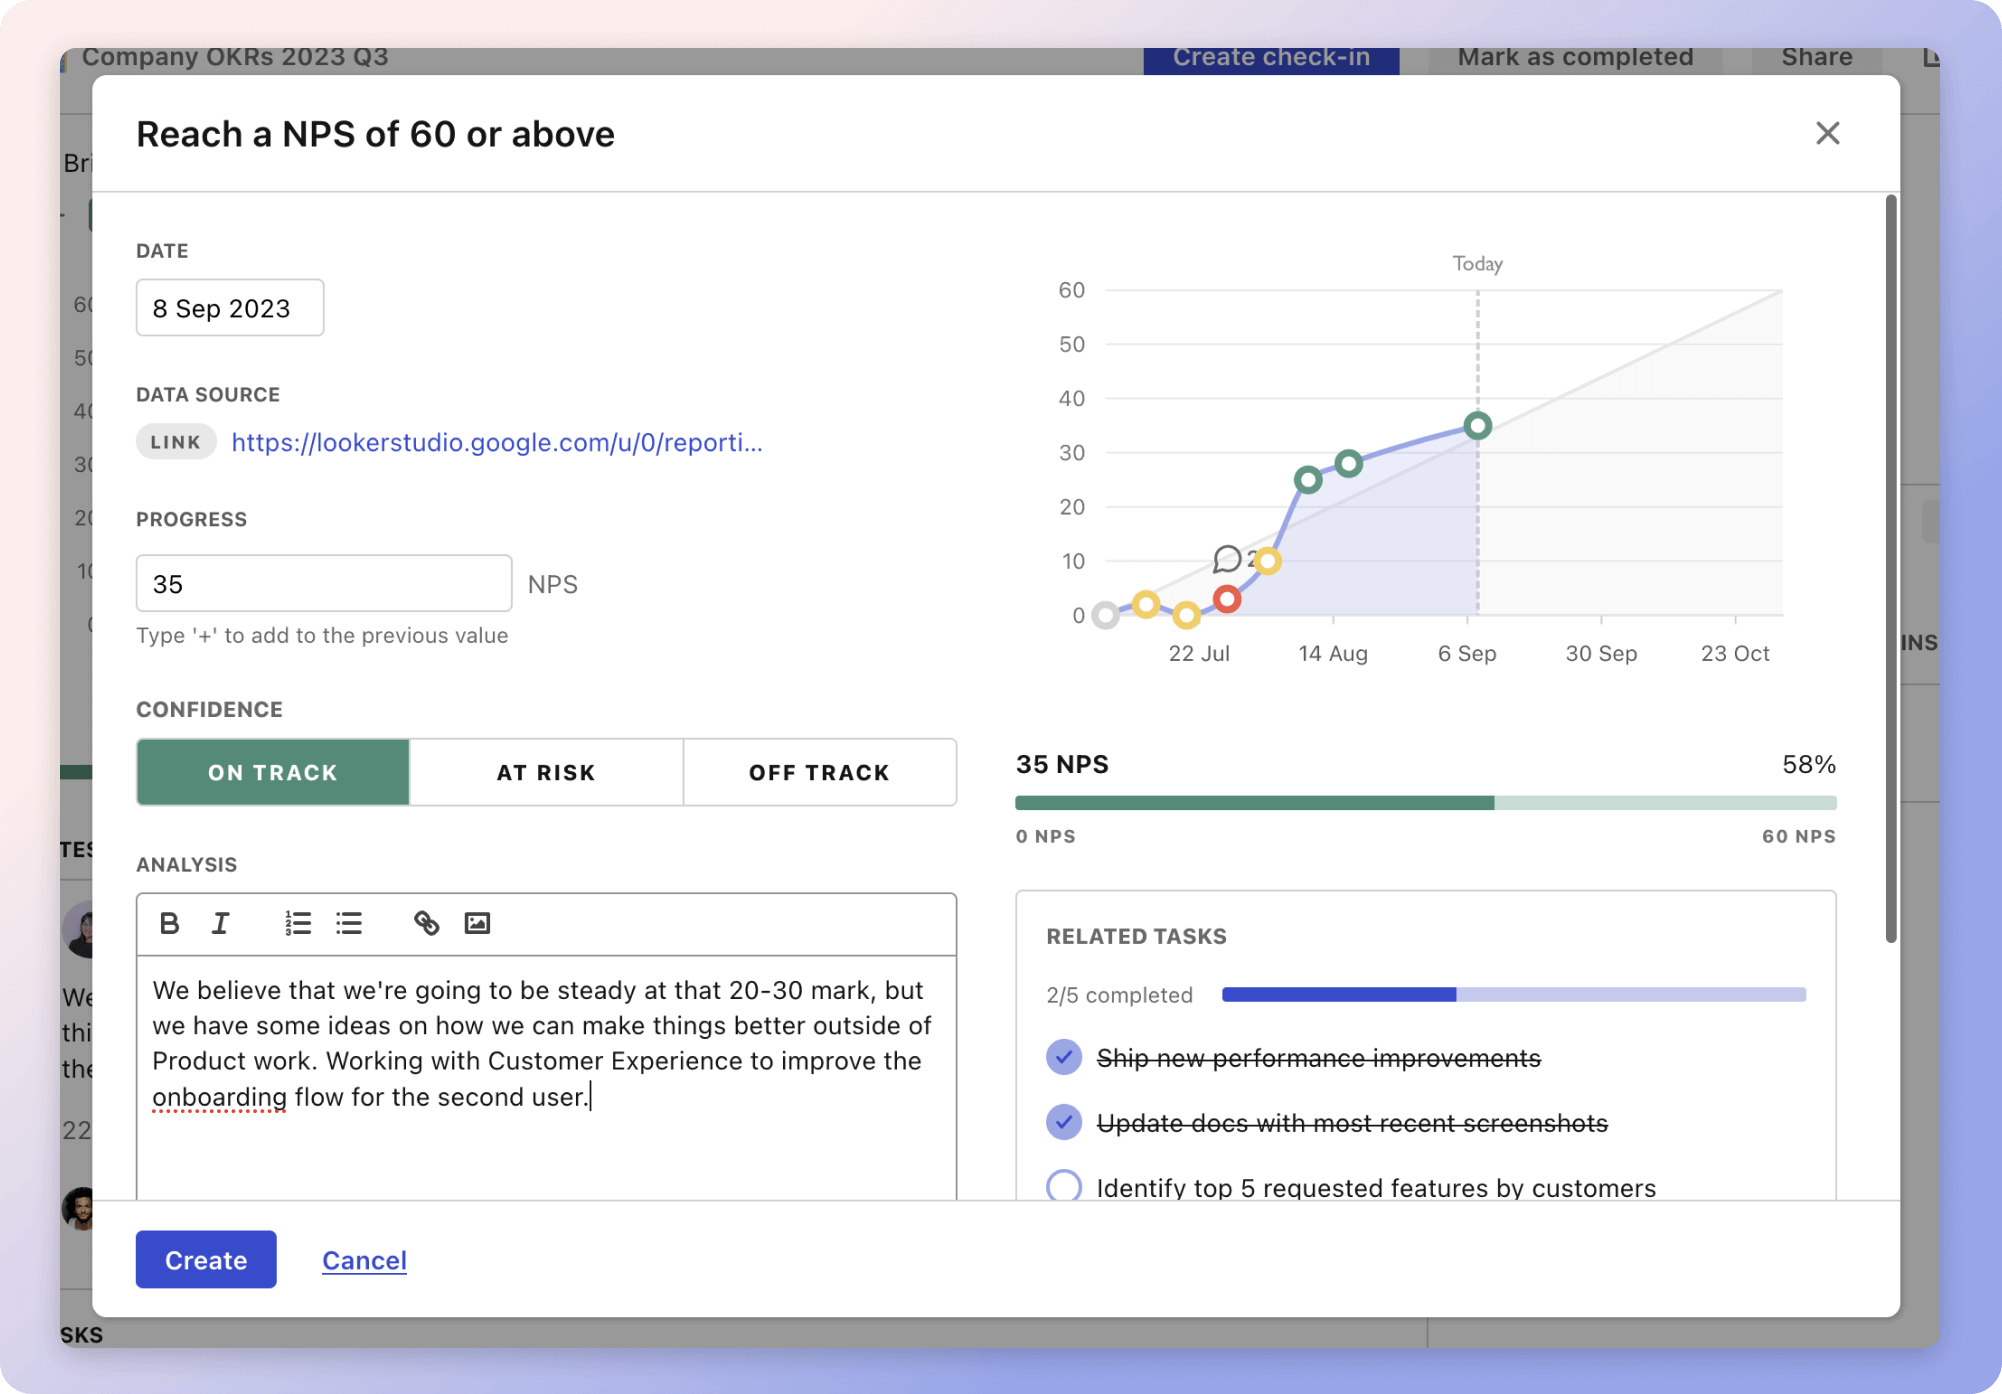
Tability Insights DashboardTability's check-ins will save you hours and increase transparency

More metrics recently published

We have more examples to help you below.

Planning resources

OKRs are a great way to translate strategies into measurable goals. Here are a list of resources to help you adopt the OKR framework:

Table of contents