Tability is a cheatcode for goal-driven teams. Set perfect OKRs with AI, stay focused on the work that matters.
What are Metrics Analyst OKRs?
The Objective and Key Results (OKR) framework is a simple goal-setting methodology that was introduced at Intel by Andy Grove in the 70s. It became popular after John Doerr introduced it to Google in the 90s, and it's now used by teams of all sizes to set and track ambitious goals at scale.
Writing good OKRs can be hard, especially if it's your first time doing it. You'll need to center the focus of your plans around outcomes instead of projects.
We understand that setting OKRs can be challenging, so we have prepared a set of examples tailored for Metrics Analyst. Take a peek at the templates below to find inspiration and kickstart your goal-setting process.
If you want to learn more about the framework, you can read our OKR guide online.
The best tools for writing perfect Metrics Analyst OKRs
Here are 2 tools that can help you draft your OKRs in no time.
Tability AI: to generate OKRs based on a prompt
Tability AI allows you to describe your goals in a prompt, and generate a fully editable OKR template in seconds.
- 1. Create a Tability account
- 2. Click on the Generate goals using AI
- 3. Describe your goals in a prompt
- 4. Get your fully editable OKR template
- 5. Publish to start tracking progress and get automated OKR dashboards
Watch the video below to see it in action 👇
Tability Feedback: to improve existing OKRs
You can use Tability's AI feedback to improve your OKRs if you already have existing goals.
- 1. Create your Tability account
- 2. Add your existing OKRs (you can import them from a spreadsheet)
- 3. Click on Generate analysis
- 4. Review the suggestions and decide to accept or dismiss them
- 5. Publish to start tracking progress and get automated OKR dashboards

Tability will scan your OKRs and offer different suggestions to improve them. This can range from a small rewrite of a statement to make it clearer to a complete rewrite of the entire OKR.
Metrics Analyst OKRs examples
You'll find below a list of Objectives and Key Results templates for Metrics Analyst. We also included strategic projects for each template to make it easier to understand the difference between key results and projects.
Hope you'll find this helpful!
OKRs to develop robust performance metrics for the new enterprise API
 ObjectiveDevelop robust performance metrics for the new enterprise API
 KRDeliver detailed API metrics report demonstrating user engagement and API performance
 Identify key API metrics to measure performance and user engagement
- Analyze and compile API usage data into a report
- Present and discuss metrics report to the team
- KREstablish three key performance indicators showcasing API functionality by Q2
- Launch the key performance indicators
- Develop measurable criteria for each selected feature
- Identify primary features to assess regarding API functionality
- KRAchieve 95% accuracy in metrics predictions testing by end of quarter
- Develop comprehensive understanding of metrics prediction algorithms
- Perform consistent testing on prediction models
- Regularly adjust algorithms based on testing results
OKRs to enhance metrics quality and interpretability
- ObjectiveEnhance metrics quality and interpretability
- KRImplement a metrics dashboard with simple, visually clear displays
- Identify key metrics to track and display
- Design a user-friendly dashboard layout
- Code and test the dashboard for functionality
- KRDevelop 5 additional relevant, actionable metrics by end of Q2
- Implement and test performance metrics
- Investigate potential key performance indicators
- Design data collection methods for new metrics
- KRIncrease the precision of metrics measurement by 15%
- Review and improve current metrics measurement processes
- Implement advanced analytics software for accurate data collection
- Train staff on precise metrics measurement skills and techniques
OKRs to implement robust tracking of core Quality Assurance (QA) metrics
- ObjectiveImplement robust tracking of core Quality Assurance (QA) metrics
- KRDevelop an automated QA metrics tracking system within two weeks
- Identify necessary metrics for quality assurance tracking
- Research and select software for automation process
- Configure software to track and report desired metrics
- KRDeliver biweekly reports showing improvements in tracked QA metrics
- Compile and submit a biweekly improvement report
- Highlight significant improvements in collected QA data
- Gather and analyze QA metrics data every two weeks
- KRAchieve 100% accuracy in data capture on QA metrics by month three
OKRs to foster continuous improvement on Engineering metrics
- ObjectiveFoster continuous improvement on Engineering metrics
- KRAchieve a 10% increase in team's average productivity metrics
- Introduce incentives for meeting or surpassing productivity goals
- Implement training sessions to improve skills and efficiency
- Optimize workflow by eliminating unnecessary procedures
- KRImplement weekly trend analysis reports for every team member
- Schedule and distribute weekly trend analysis to each team member
- Establish report templates to track weekly trends for each team
- Automate data collection and trend analysis processes
- KRReduce error rates in engineering processes by 15%
- Enhance quality control and testing procedures
- Regularly review and improve existing engineering processes
- Implement training programs to update engineering knowledge and skills
OKRs to develop robust metrics for social media content assessment
- ObjectiveDevelop robust metrics for social media content assessment
- KRMinimize measurement errors to 2% or less across all evaluated social media content
- Implement precise analytics tools for accurate data collection
- Regularly audit data sets to identify discrepancies
- Train teams on data collection best practices
- KRCreate a standardized measurement framework for evaluating content by week 8
- Review existing content evaluation methods by week 2
- Finalize and implement framework by week 8
- Establish criteria for standardized measurements by week 5
- KRIdentify and define 10 key performance indicators for social media by the end of week 4
- Prepare definitions for each chosen indicator
- Research potential key performance indicators for social media
- Draft list of the 10 most relevant indicators
Metrics Analyst OKR best practices
Generally speaking, your objectives should be ambitious yet achievable, and your key results should be measurable and time-bound (using the SMART framework can be helpful). It is also recommended to list strategic initiatives under your key results, as it'll help you avoid the common mistake of listing projects in your KRs.
Here are a couple of best practices extracted from our OKR implementation guide 👇
Tip #1: Limit the number of key results
The #1 role of OKRs is to help you and your team focus on what really matters. Business-as-usual activities will still be happening, but you do not need to track your entire roadmap in the OKRs.
We recommend having 3-4 objectives, and 3-4 key results per objective. A platform like Tability can run audits on your data to help you identify the plans that have too many goals.
Tip #2: Commit to weekly OKR check-ins
Don't fall into the set-and-forget trap. It is important to adopt a weekly check-in process to get the full value of your OKRs and make your strategy agile – otherwise this is nothing more than a reporting exercise.
Being able to see trends for your key results will also keep yourself honest.
Tip #3: No more than 2 yellow statuses in a row
Yes, this is another tip for goal-tracking instead of goal-setting (but you'll get plenty of OKR examples above). But, once you have your goals defined, it will be your ability to keep the right sense of urgency that will make the difference.
As a rule of thumb, it's best to avoid having more than 2 yellow/at risk statuses in a row.
Make a call on the 3rd update. You should be either back on track, or off track. This sounds harsh but it's the best way to signal risks early enough to fix things.
Save hours with automated Metrics Analyst OKR dashboards
The rules of OKRs are simple. Quarterly OKRs should be tracked weekly, and yearly OKRs should be tracked monthly. Reviewing progress periodically has several advantages:
- It brings the goals back to the top of the mind
- It will highlight poorly set OKRs
- It will surface execution risks
- It improves transparency and accountability
Most teams should start with a spreadsheet if they're using OKRs for the first time. Then, you can move to Tability to save time with automated OKR dashboards, data connectors, and actionable insights.
How to get Tability dashboards:
- 1. Create a Tability account
- 2. Use the importers to add your OKRs (works with any spreadsheet or doc)
- 3. Publish your OKR plan
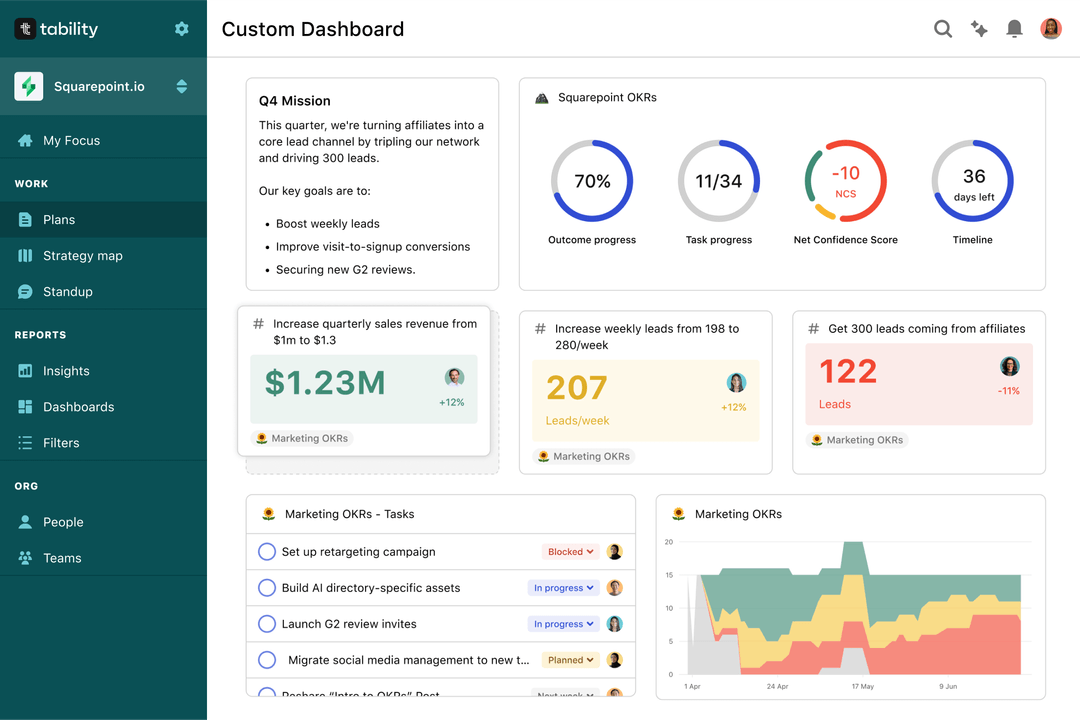
That's it! Tability will instantly get access to 10+ dashboards to monitor progress, visualise trends, and identify risks early.
More Metrics Analyst OKR templates
We have more templates to help you draft your team goals and OKRs.
- OKRs to enhance administrative efficiency and effectiveness
- OKRs to implement IdentityNow for efficient account creation
- OKRs to streamline and optimize the payroll process
- OKRs to successfully launch the Minimum Viable Product for Product Information Management
- OKRs to implement single account just-in-time access system
- OKRs to establish a successful National Archive Centre business